실습에 사용할 sklearn 모듈 및 메소드
from sklearn.model_selection   import train_test_split,  cross_val_predict
#데이터셋 훈련용, 테스트용 분리/ 교차검증 (순서대로)
from sklearn.naive_bayes       import GaussianNB
#Naive_bayes의 GaussianNB(정규분포) 모형
from sklearn.metrics           import accuracy_score,  precision_score,  recall_score,  f1_score
#정확도/ 정밀도/ 재현율/ F1 Score(정밀도와 재현율의 조화평균)
from sklearn.metrics           import confusion_matrix, average_precision_score
#오차행렬/ 평균정밀도
from sklearn.metrics           import precision_recall_curve,  roc_curve,  roc_auc_score
#정밀도와 재현율 곡선/ ROC 커브/ AUC(Area Under the Curve)
- 앞의 내용 연결 및 복습
import numpy as np
import pandas as pd
import matplotlib.pyplot as plt
%matplotlib inline

from sklearn.model_selection import train_test_split

# 데이터를 읽어들이고 고려할 특성을 선택
data = pd.read_csv('./datasets/PimaIndiansDiabetes.csv')
data_subset = data.loc[:,['Blood Glucose', 'BMI', 'Class']]

# 데이터 정제
bg_mask = data_subset.loc[:,"Blood Glucose"]!=0
bmi_mask = data_subset.loc[:,"BMI"]!=0
clean_data_subset = data_subset[bg_mask & bmi_mask]

# 전체 샘플 중 레이블이 1인 샘플의 비율이 0.35, 0인 샘플의 비율이 0.65
(clean_data_subset.Class==1).sum() / len(clean_data_subset)

# 테스트 데이터셋 분리 (레이블의 비율을 고려하여 데이터셋 분리)
trainD, testD = train_test_split(clean_data_subset, test_size=0.2, random_state=20, stratify=clean_data_subset.Class) #staratify: 비율에 맞춰서 테스트 데이터셋 분리

(testD.Class==1).sum()/len(testD) # 0.3509933774834437
(trainD.Class==1).sum()/len(trainD) #  0.35108153078202997

X_train = trainD[['Blood Glucose', 'BMI']]
y_train = trainD['Class']
X_test = testD[['Blood Glucose', 'BMI']]
y_test = testD['Class']
- 위 과정을
sklearn.model_selection모듈의cross_val_predict메소드를 이용 (API)
# cross_val_predict 를 이용하여 임곗값에 따른 정확도 비교

from sklearn.model_selection import cross_val_predict
from sklearn.naive_bayes import GaussianNB
from sklearn.metrics import accuracy_score

classifier = GaussianNB()

y_val_probs = cross_val_predict(classifier, X_train, y_train, cv=5, method="predict_proba")
# 분류기, data_X, data_y, cv=cross-validation generator(몇개로 나누어서 검증을 할 것인지), method:default-predict, predict_proba는 확률을 알려줌
y_val_prob1 = y_val_probs[:,1] # 샘플이 주어질 때, 레이블이 1이 될 확률을 y_train와 같은 index순으로 구함

thresholds = np.linspace(0,1,101)  # 0과 1을 포함하여 [0,1]을 100등분
acc = []
for t in thresholds:
    y_val_pred = y_val_prob1 >= t
    acc.append(accuracy_score(y_train, y_val_pred))
best_threshold = thresholds[np.argmax(acc)]

print(f"정확도는 임곗값이 t={best_threshold}일 때 {acc[np.argmax(acc)]*100 :.2f}%")
print(f"임곗값이 0.5일 때 정확도는 {acc[list(thresholds).index(0.5)]*100 : .2f}%")

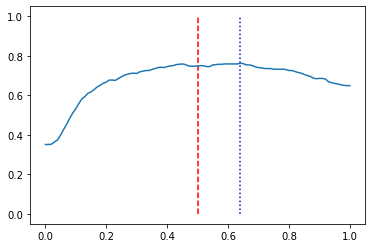
#정확도는 임곗값이 t=0.64일 때 76.21%
#임곗값이 0.5일 때 정확도는 74.88%

plt.plot(thresholds, acc)
plt.vlines(0.5, 0,1, colors='r',linestyles='dashed')
plt.vlines(0.64, 0,1, colors='b', linestyle='dotted')

1. 오차 행렬(confusion matrix)
:실제 클래스와 예측 클래스로 구성된 횟수를 정리한 표
EX) 레이블이 0(음성),1(양성)인 경우 오차행렬은 다음과 같음
(예측된) 음성 (예측된) 양성 (실제)음성 TN FP (실제)양성 FN TP
오차행렬 구현
y_val_pred = (y_val_prob1 > best_threshold)

# y의 레이블 종류가 2개인 경우1
def my_confusion_matrix1(y_true, y_pred):
    tn = ((y_true==0) & (y_pred==0)).sum()
    fp = ((y_true==0) & (y_pred==1)).sum()
    fn = ((y_true==1) & (y_pred==0)).sum()
    tp = ((y_true==1) & (y_pred==1)).sum()
    return np.array([[tn, fp],[fn,tp]])

# y의 레이블 종류가 2개인 경우2
def my_confusion_matrix2(y_true, y_pred):
    cf_mat = np.zeros((2,2), dtype=int)
    for i in range(2):
        for j in range(2):
            cf_mat[i,j] = ((y_true == i) & (y_pred == j)).sum()
    return cf_mat
sklearn.metrics 모듈의 confusion_matrix 사용
from sklearn.metrics import confusion_matrix

cf_matrix = confusion_matrix(y_train, y_val_pred)
cf_matrix
세 방법 모두 아래와 같은 답을 얻을 수 있다.
array([[365, 25],
[118, 93]], dtype=int64)
2. 오차행렬의 해석
row_sums = cf_matrix.sum(axis=1, keepdims=True)
# cf_matrix.sum(axis=1)와 같이 keepdims=False로 해도 아래

norm_cf_matrix = cf_matrix / row_sums

norm_cf_matrix
array([[0.93589744, 0.06410256],
[0.55924171, 0.44075829]])
3. 정밀도(precision) 와 재현율(recall)
-
정밀도(precision) =TP / (TP+FP)
문제점: 양성에 대해 가장 강한 확신이 드는 샘플만 양성이라 하고 나머지는 음성이라 판단하는 분류기는 유용하지 않지만 정밀도는 1로 완벽해진다. 이 문제를 보완하기 위해 재현율이라는 지표 사용
- 재현율(recall), 민감도(sensitivity),진짜 양성 비율(TPR: True Positive Rate) : TP / (TP+FN)
- F1 score: (2 * precison * recall)/(precision+recall) (정밀도와 재현율의 조화평균)
상황에 따라 재현율을 다소 포기하더라도 정밀도를 높이는 것이 필요한 경우도 있고, 그 반대 경우도 있을 수 있음 ( 이론 연습문제 1, 2 참고)
from sklearn.metrics import precision_score, recall_score, f1_score

thresholds_1 = np.unique(y_val_prob1)
precisions_1 = []
recalls_1 = []
f1s_1 = []

for t in thresholds_1:
    y_val_pred = (y_val_prob1 >= t)
    precisions_1.append(precision_score(y_train, y_val_pred))
    recalls_1.append(recall_score(y_train, y_val_pred))
    f1s_1.append(f1_score(y_train, y_val_pred))

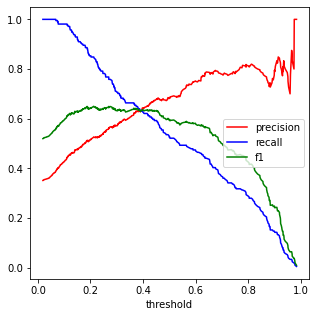
plt.figure(figsize=(5,5))
plt.plot(thresholds_1, precisions_1, c='r', label="precision")
plt.plot(thresholds_1, recalls_1, c='b', label="recall")
plt.plot(thresholds_1, f1s_1, c='g', label="f1")

plt.legend(loc="center right", fontsize=10)
plt.xlabel("threshold", fontsize=10)

thresholds_1[np.argmax(thresholds_1 >=0.5)]
#0.5014972167017477 임계값 0.5 이상에서 가장 큰 임계값

print(precisions_1[np.argmax(thresholds_1 >=0.5)])
print(recalls_1[np.argmax(thresholds_1 >=0.5)])

#0.6851851851851852
#0.5260663507109005

# 정밀도와 재현율이 같아지는 임곗값
pr_eq_t = np.argmax(np.array(precisions_1)- np.array(recalls_1)==0)
print(thresholds_1[pr_eq_t])
print(precisions_1[pr_eq_t])
print(recalls_1[pr_eq_t])

#0.3912079171353838
#0.6303317535545023
#0.6303317535545023
sklearn.metrics 모듈의 precision_recall-curve
from sklearn.metrics import precision_recall_curve

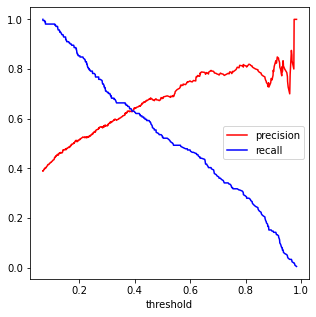
precisions_2, recalls_2, thresholds_2 = precision_recall_curve(y_train, y_val_prob1)

plt.figure(figsize=(5,5))
plt.plot(thresholds_2, precisions_2[:-1], c='r', label="precision")
plt.plot(thresholds_2, recalls_2[:-1], c='b', label="recall")

plt.legend(loc="center right", fontsize=10)
plt.xlabel("threshold", fontsize=10)

4. 좋은 정밀도/재현율 균형을 선택하는 방법-PR곡선
-
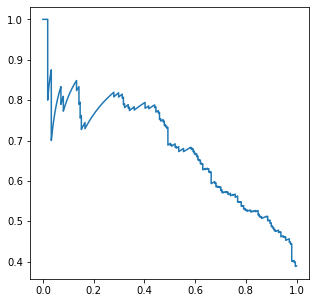
재현율에 대한 정밀도 곡선을 그려서 문제 선택에 맞는 임계값 선택
-
일반적으로 정밀도가 급격하게 떨어지기 직전을 정밀도.재현율 균형으로 선택
-
서로 다른 두 모델을 비교해서 선택하는 상황에서는 PR곡선 아래 넓이가 큰 모델이 좋은 모델
PR 곡선 넓이 구할 때
sklearn.metric모듈의average_precision_score를 이용
plt.figure(figsize=(5,5))
plt.plot(recalls_2, precisions_2)

from sklearn.metrics import average_precision_score

print(f"PR 곡선 아래의 넓이는 {average_precision_score(y_train, y_val_prob1) : 0.2f}")
#PR 곡선 아래의 넓이는  0.68
Reference:
- 기계학습_하길찬 교수님 수업을 바탕으로 공부한 내용입니다.