import pandas as pd  #판다스

from sklearn.linear_model import LogisticRegression #로지스틱 회귀 모델

from sklearn.tree import DecisionTreeClassifier #의사결정 나무 모델
#데이터 불러오기


train=pd.read_csv('../input/titanic/train.csv') #모델 학습

test=pd.read_csv('../input/titanic/test.csv') #모델 시험지

submission=pd.read_csv('../input/titanic/gender_submission.csv') #답안지
EDA
train.head()
| PassengerId | Survived | Pclass | Name | Sex | Age | SibSp | Parch | Ticket | Fare | Cabin | Embarked | |
|---|---|---|---|---|---|---|---|---|---|---|---|---|
| 0 | 1 | 0 | 3 | Braund, Mr. Owen Harris | male | 22.0 | 1 | 0 | A/5 21171 | 7.2500 | NaN | S |
| 1 | 2 | 1 | 1 | Cumings, Mrs. John Bradley (Florence Briggs Th... | female | 38.0 | 1 | 0 | PC 17599 | 71.2833 | C85 | C |
| 2 | 3 | 1 | 3 | Heikkinen, Miss. Laina | female | 26.0 | 0 | 0 | STON/O2. 3101282 | 7.9250 | NaN | S |
| 3 | 4 | 1 | 1 | Futrelle, Mrs. Jacques Heath (Lily May Peel) | female | 35.0 | 1 | 0 | 113803 | 53.1000 | C123 | S |
| 4 | 5 | 0 | 3 | Allen, Mr. William Henry | male | 35.0 | 0 | 0 | 373450 | 8.0500 | NaN | S |
PassengerId: 탑승객의 고유 아이디/ Survival: 생존유무(0: 사망, 1: 생존)/ Pclass: 등실의 등급/
Name:이름/ Sex: 성별/ Age: 나이/ Sibsp: 함께 탑승한 형제자매, 아내, 남편의 수/
Parch: 함께 탑승한 부모, 자식의 수/ Ticket: 티켓번호/ Fare: 티켓의 요금/
Cabin: 객실번호/ Embarked: 배에 탑승한 위치(C = Cherbourg, Q = Queenstown, S = Southampton)
test.head()
| PassengerId | Pclass | Name | Sex | Age | SibSp | Parch | Ticket | Fare | Cabin | Embarked | |
|---|---|---|---|---|---|---|---|---|---|---|---|
| 0 | 892 | 3 | Kelly, Mr. James | male | 34.5 | 0 | 0 | 330911 | 7.8292 | NaN | Q |
| 1 | 893 | 3 | Wilkes, Mrs. James (Ellen Needs) | female | 47.0 | 1 | 0 | 363272 | 7.0000 | NaN | S |
| 2 | 894 | 2 | Myles, Mr. Thomas Francis | male | 62.0 | 0 | 0 | 240276 | 9.6875 | NaN | Q |
| 3 | 895 | 3 | Wirz, Mr. Albert | male | 27.0 | 0 | 0 | 315154 | 8.6625 | NaN | S |
| 4 | 896 | 3 | Hirvonen, Mrs. Alexander (Helga E Lindqvist) | female | 22.0 | 1 | 1 | 3101298 | 12.2875 | NaN | S |
submission.head() #여성 1 남성 0
| PassengerId | Survived | |
|---|---|---|
| 0 | 892 | 0 |
| 1 | 893 | 1 |
| 2 | 894 | 0 |
| 3 | 895 | 0 |
| 4 | 896 | 1 |
- 훈련 데이터, 테스트 데이터 파악
print(train.shape) #속성을 나타내는 shape 메소드는 ()쓰지 않는다.

print(test.shape) #각 파일의 데이터 크기 파악

print(submission.shape)
(891, 12)

(418, 11)

(418, 2)
train.info() #기본적이고 전체적인 데이터 파악
<class 'pandas.core.frame.DataFrame'>

RangeIndex: 891 entries, 0 to 890

Data columns (total 12 columns):

 #   Column       Non-Null Count  Dtype

---  ------       --------------  -----

 0   PassengerId  891 non-null    int64

 1   Survived     891 non-null    int64

 2   Pclass       891 non-null    int64

 3   Name         891 non-null    object

 4   Sex          891 non-null    object

 5   Age          714 non-null    float64

 6   SibSp        891 non-null    int64

 7   Parch        891 non-null    int64

 8   Ticket       891 non-null    object

 9   Fare         891 non-null    float64

 10  Cabin        204 non-null    object

 11  Embarked     889 non-null    object

dtypes: float64(2), int64(5), object(5)

memory usage: 83.7+ KB
test.info()
<class 'pandas.core.frame.DataFrame'>

RangeIndex: 418 entries, 0 to 417

Data columns (total 11 columns):

 #   Column       Non-Null Count  Dtype

---  ------       --------------  -----

 0   PassengerId  418 non-null    int64

 1   Pclass       418 non-null    int64

 2   Name         418 non-null    object

 3   Sex          418 non-null    object

 4   Age          332 non-null    float64

 5   SibSp        418 non-null    int64

 6   Parch        418 non-null    int64

 7   Ticket       418 non-null    object

 8   Fare         417 non-null    float64

 9   Cabin        91 non-null     object

 10  Embarked     418 non-null    object

dtypes: float64(2), int64(4), object(5)

memory usage: 36.0+ KB
print(train.describe()) #각 데이터의 기술 통계량 확인

print(test.describe())
       PassengerId    Survived      Pclass         Age       SibSp  \

count   891.000000  891.000000  891.000000  714.000000  891.000000

mean    446.000000    0.383838    2.308642   29.699118    0.523008

std     257.353842    0.486592    0.836071   14.526497    1.102743

min       1.000000    0.000000    1.000000    0.420000    0.000000

25%     223.500000    0.000000    2.000000   20.125000    0.000000

50%     446.000000    0.000000    3.000000   28.000000    0.000000

75%     668.500000    1.000000    3.000000   38.000000    1.000000

max     891.000000    1.000000    3.000000   80.000000    8.000000


            Parch        Fare

count  891.000000  891.000000

mean     0.381594   32.204208

std      0.806057   49.693429

min      0.000000    0.000000

25%      0.000000    7.910400

50%      0.000000   14.454200

75%      0.000000   31.000000

max      6.000000  512.329200

       PassengerId      Pclass         Age       SibSp       Parch        Fare

count   418.000000  418.000000  332.000000  418.000000  418.000000  417.000000

mean   1100.500000    2.265550   30.272590    0.447368    0.392344   35.627188

std     120.810458    0.841838   14.181209    0.896760    0.981429   55.907576

min     892.000000    1.000000    0.170000    0.000000    0.000000    0.000000

25%     996.250000    1.000000   21.000000    0.000000    0.000000    7.895800

50%    1100.500000    3.000000   27.000000    0.000000    0.000000   14.454200

75%    1204.750000    3.000000   39.000000    1.000000    0.000000   31.500000

max    1309.000000    3.000000   76.000000    8.000000    9.000000  512.329200
train['Embarked'].value_counts() #배에 탑승한 위치
S    644

C    168

Q     77

Name: Embarked, dtype: int64
train['Embarked'].unique() #unique 메소드는 시리즈로 접근
array(['S', 'C', 'Q', nan], dtype=object) #나오는 순서대로 나옴
train.groupby('Sex').mean()
| PassengerId | Survived | Pclass | Age | SibSp | Parch | Fare | |
|---|---|---|---|---|---|---|---|
| Sex | |||||||
| female | 431.028662 | 0.742038 | 2.159236 | 27.915709 | 0.694268 | 0.649682 | 44.479818 |
| male | 454.147314 | 0.188908 | 2.389948 | 30.726645 | 0.429809 | 0.235702 | 25.523893 |
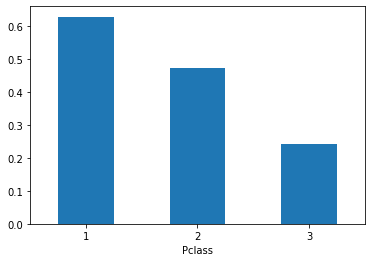
train.groupby('Pclass').mean()
| PassengerId | Survived | Age | SibSp | Parch | Fare | |
|---|---|---|---|---|---|---|
| Pclass | ||||||
| 1 | 461.597222 | 0.629630 | 38.233441 | 0.416667 | 0.356481 | 84.154687 |
| 2 | 445.956522 | 0.472826 | 29.877630 | 0.402174 | 0.380435 | 20.662183 |
| 3 | 439.154786 | 0.242363 | 25.140620 | 0.615071 | 0.393075 | 13.675550 |
#시각화

#pd.Series.plot(kind='bar')


train.groupby('Pclass').mean()['Survived'].plot(kind='bar', rot=0)  #rot=0 x축 명칭 회전 수정/ rot=45는 비스듬히(각도)
<AxesSubplot:xlabel='Pclass'>

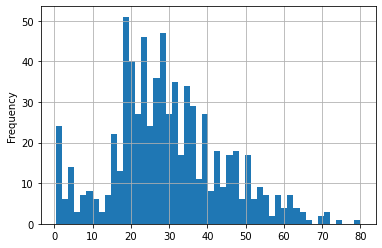
train['Age'].plot(kind='hist',bins=50,grid=True) #bins 도수를 더 잘게 나눔 grid로 보조선까지 추가
<AxesSubplot:ylabel='Frequency'>

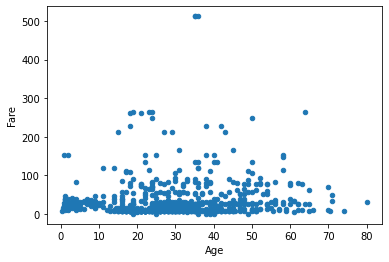
train.plot(x='Age',y='Fare',kind='scatter')
<AxesSubplot:xlabel='Age', ylabel='Fare'>

데이터 전처리
#결측값 파악

train.isna().sum()
PassengerId      0

Survived         0

Pclass           0

Name             0

Sex              0

Age            177

SibSp            0

Parch            0

Ticket           0

Fare             0

Cabin          687

Embarked         2

dtype: int64
- 나이 결측값 해결
train['Age'].median() #중앙값으로 대체
28.0
train['Age'].fillna(28)#이것만 쓰면 저장이 안됨! 일시적으로 나타내주기만 한다.

train['Age']=train['Age'].fillna(28) #train['Age'] 에 다시 저장
train.isna().sum() #Age 확인
PassengerId      0

Survived         0

Pclass           0

Name             0

Sex              0

Age              0

SibSp            0

Parch            0

Ticket           0

Fare             0

Cabin          687

Embarked         2

dtype: int64
- 좌석 등급 결측값
train['Embarked'].value_counts()
S    644

C    168

Q     77

Name: Embarked, dtype: int64
train['Embarked']=train['Embarked'].fillna('S') #제일 많은 값인 S로 채워주겠다.
train.isna().sum() #Embarked 확인
PassengerId      0

Survived         0

Pclass           0

Name             0

Sex              0

Age              0

SibSp            0

Parch            0

Ticket           0

Fare             0

Cabin          687

Embarked         0

dtype: int64
- 객실번호는 유의미한 변수가 아니라 판단, 전처리 과정에서 제외하겠다.
#pd.Series.map() #시리즈 내 값을 변환할 때 사용하는 함수

#남자는 0, 여자는 1로 값 변경

train['Sex']=train['Sex'].map({'male':0,'female':1})
train['Sex']
0      0

1      1

2      1

3      1

4      0

      ..

886    0

887    1

888    1

889    0

890    0

Name: Sex, Length: 891, dtype: int64
모델링
#X -> MODEL -> y

#변수는 성별과 좌석 등급으로 정했다.

X_train=train[['Sex','Pclass']]

y_train=train['Survived']
test['Sex']=test['Sex'].map({'male':0,'female':1})

X_test=test[['Sex','Pclass']]
X_test
| Sex | Pclass | |
|---|---|---|
| 0 | 0 | 3 |
| 1 | 1 | 3 |
| 2 | 0 | 2 |
| 3 | 0 | 3 |
| 4 | 1 | 3 |
| ... | ... | ... |
| 413 | 0 | 3 |
| 414 | 1 | 1 |
| 415 | 0 | 3 |
| 416 | 0 | 3 |
| 417 | 0 | 3 |
418 rows × 2 columns
lr=LogisticRegression()

dt=DecisionTreeClassifier()
lr.fit(X_train,y_train)
LogisticRegression()
dt.fit(X_train,y_train)
DecisionTreeClassifier()
lr_pred=lr.predict_proba(X_test)[:,1]
dt_pred=dt.predict_proba(X_test)[:,1]
submission['Survived']=lr_pred

submission
| PassengerId | Survived | |
|---|---|---|
| 0 | 892 | 0.102021 |
| 1 | 893 | 0.593544 |
| 2 | 894 | 0.224759 |
| 3 | 895 | 0.102021 |
| 4 | 896 | 0.593544 |
| ... | ... | ... |
| 413 | 1305 | 0.102021 |
| 414 | 1306 | 0.904848 |
| 415 | 1307 | 0.102021 |
| 416 | 1308 | 0.102021 |
| 417 | 1309 | 0.102021 |
418 rows × 2 columns
submission.to_csv('logistic_regression_pred.csv',index=False) #False 안하면 행을 나타내는 인덱스가 같이 저장됨
submission['Survived']=dt_pred

submission
| PassengerId | Survived | |
|---|---|---|
| 0 | 892 | 0.135447 |
| 1 | 893 | 0.500000 |
| 2 | 894 | 0.157407 |
| 3 | 895 | 0.135447 |
| 4 | 896 | 0.500000 |
| ... | ... | ... |
| 413 | 1305 | 0.135447 |
| 414 | 1306 | 0.968085 |
| 415 | 1307 | 0.135447 |
| 416 | 1308 | 0.135447 |
| 417 | 1309 | 0.135447 |
418 rows × 2 columns
submission.to_csv('decision_tree_pred.csv',index=False) #정답지 제출
-
로지스틱, 결정트리모형을 이용해 제출해봤으나 비슷한 점수가 나왔고 추후 로지스틱 회귀 모형에 변수를 추가하는 방식으로 접근했다.
-
올바른 변수를 선택하는 법을 조금 더 고려해보아야 할 것 같다.
Reference:
-
데이콘의 타이타닉 생존자 예측하기 실습
-
Kaggle의 타이타닉 생존자 예측 데이터 자료