과대적합을 감소시키는 방법: 규제(Regularization)
-
- 주어진 학습모델의 과대적합을 감소시키는 방법
-
모델의 복잡도를 줄이는 것(다항회귀의 경우 다항식 차수를 감소)
-
선형회귀 모델에서는 모델의 가중치를 제한함으로써 규제를 가해 과대적합을 감소시킬 수 있음
- 손실함수 RSS$(\theta)$에 규제항(regularization term)을 추가한 손실함수 $J(\theta)$가 최소가 되는 모델 파라미터 $\theta$를 구함 : 모델의 가중치가 가능한 한 작게 유지되면서 학습 알고리즘이 데이터에 맞추도록 학습
(단, 모델 파라미터 ${\theta}=(\theta_0,\theta_1,\cdots,\theta_n)^{\rm T}$에서 $\theta_0$는 절편, $\mathbf w=(\theta_1,\cdots,\theta_n)^{\rm T}$는 가중치)
규제항은 학습하는 동안에만 비용함수에 추가되고, 성능을 평가할 때는 MSE로만 평가
$\alpha$는 모델의 가중치를 얼마나 규제할 지 조절하는 하이퍼파라미터
- $\alpha$=0는 규제가 없는 선형회귀
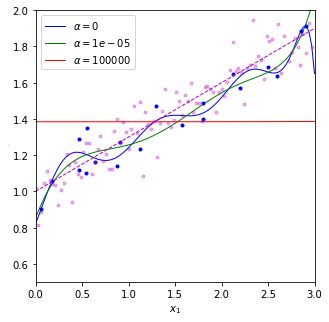
- $\alpha$가 아주 크면 모든 가중치가 거의 0에 가까워지고, 결국 데이터의 평균을 지나는 수평선에 가까워짐
규제가 있는 모델은 데이터의 스케일링이 꼭 필요함.
-
p=2일 때, 즉, 패널티로 $\ell_2$ 노름(norm)을 사용할 때 릿지회귀 (Ridge Regression)
-
p=1일 때, 즉, 패널티로 $\ell_1$ 노름(norm)을 사용할 때 라쏘회귀 (Lasso Regression)
-
엘라스틱넷(elastic net): 규제항을 릿지회귀의 규제항과 라쏘회귀의 규제항에 대한 내분점으로 정의.
즉, $0\le r \le 1$에 대해 다음과 같이 손실함수를 정의 \(J( \theta)=\text{RSS}(\theta ) + r(\alpha||\mathbf w||_1 )+(1-r)({\alpha} ||\mathbf w||_2^2)\)
릿지 회귀(Ridge Regression)
-
릿지 회귀를 학습하기 위해 정규방정식을 이용할 수도 있고 경사하강법을 이용할 수도 있음
-
릿지회귀에 대한 정규방정식
\[J(\theta)= RSS(\theta)+\alpha(||\mathbf w||_2)^2 (\alpha >0) =\text{RSS}(\theta ) + \alpha\ \sum_{i=1}^n |\theta_i|^2\]-
위의 경우 손실함수 $J(\theta)$는 아래로 볼록한 함수(convex function)이 되므로 $\nabla_{\theta}J(\theta)=\mathbf 0$이 되는 $\theta$에서 최소가 된다.
(단, (n+1) X (n+1) 행렬 $\mathbf A$는 $A_{11}=0$이고 $A_{ii}=1\ (1\le i \le n)$인 대각행렬)
-
$(\mathbf X^{\rm T}\mathbf X+\alpha \mathbf A)\theta = \mathbf X^{\rm T}\mathbf y$로부터 $\hat{\theta} = (\mathbf X^{\rm T}\mathbf X +\alpha \mathbf A)^{-1}\mathbf X^{\rm T}\mathbf y$
-
위 식은 확장된 $m$개의 특성벡터 $\mathbf x=(x_0,x_1,\cdots,x_n)^{\rm T}=(1,x_1,\cdots,x_n)^{\rm T}$로부터 생성된 $m\times (n+1)$ 행렬 $\mathbf X$에 대한 식
-
$x_0=1$을 추가하지 않은 m개의 특성벡터 $\mathbf x$로부터 생성된 $m\times n$ 행렬 $\mathbf X$와 편향(절편) $\theta_0$를 제외한 가중치로만 이루어진 파라미터 $\mathbf w=(\theta_1,\cdots,\theta_n)^{\rm T}$에 대한 정규방정식은 $\hat {\mathbf w}=(\mathbf X^{\rm T}\mathbf X +\alpha \mathbf I_n)^{-1}\mathbf X^{\rm T}\mathbf y$
-
- 규제가 없는 선형회귀 모델에서 설명했듯이 행렬에 대한 특잇값 분해를 이용하거나 촐레스키 분해(cholesky decomposition)을 이용하여 구현하는 것이 빠름
- 촐레스키 분해: 양의 정부호(positive definite)인 대칭행렬 $\mathbf A$를 하삼각행렬 $\mathbf L$을 이용하여 $\mathbf A=\mathbf L\mathbf L^{\rm T}$와 같이 분해하는 것 (참고링크)
- sklearn.linear_model모듈의 Rigde를 사용하여 예측기 객체를 생성 (API):
Ridge객체의 입력 옵션 중solver의 기본값은 ‘auto’이고 ‘svd’, ‘cholesky’ 등을 선택할 수 있다.
-
릿지 회귀에 대한 확률적 경사하강법
- sklearn.linear_model 모듈의 SGDRegressor에서 입력변수
penalty를 “l2”로 지정하여 릿지모델 생성 가능 - sklearn.linear_model 모듈의 Ridge에서 입력변수
solver를 “cholesky” ,”sag” 를 주어 정규방정식의 해를 다른 방법으로 구할 수 있음
- sklearn.linear_model 모듈의 SGDRegressor에서 입력변수
#릿지회귀 python 예시
import numpy as np

from sklearn.linear_model import LinearRegression #선형회귀
from sklearn.linear_model import Ridge #릿지모델
from sklearn.linear_model import SGDRegressor # 확률적경사하강법

from sklearn.preprocessing import StandardScaler #스케일링
from sklearn.preprocessing import PolynomialFeatures # 높은 차수 식

import matplotlib.pyplot as plt  #그래프
%matplotlib inline

np.random.seed(42)

m = 20
X = 3 * np.random.rand(m, 1)
y = 1 + 0.3 * X + 0.1 * np.random.randn(m, 1)

X_new = np.linspace(0, 3, 100).reshape(100, 1)
y_new = 1 + 0.3 * X_new + 0.1 * np.random.randn(100, 1)

def plot_model_pre(model_class, alphas, **model_kargs): #딕셔너리 형태로 받아들임 *args 는 튜플의 형태로 받아들임
    for alpha, style in zip(alphas, ("b-", "g-", "r-")): #각 알파 값에 파랑, 초록, 빨강 순으로 그래프에 그려질 색 정함
        model = model_class(alpha, **model_kargs) if alpha > 0 else LinearRegression()

        poly_features = PolynomialFeatures(degree=10, include_bias=False) #X0 제외. 10차 방정식
        std_scaler = StandardScaler() #스케일링

        X_poly = poly_features.fit_transform(X) #생성, 변환 한번에
        X_poly_scaled = std_scaler.fit_transform(X_poly) # 생성, 변환 한번에
        model.fit(X_poly_scaled, y) #학습

        y_new_regul = model.predict(std_scaler.transform(poly_features.transform(X_new))) #예측
        plt.plot(X_new, y_new_regul, style, linewidth=1, label=r"$\alpha = {}$".format(alpha))

    plt.plot(X, y, "b.", linewidth=3)
    plt.plot(X_new,y_new, "m.", linewidth=3, alpha=0.3)
    plt.plot(X_new, 1+0.3*X_new, "m--", linewidth=1)
    plt.legend(loc="upper left", fontsize=10)
    plt.xlabel("$x_1$", fontsize=10)
    plt.axis([0, 3, 0.5, 2])

plt.figure(figsize=(5,5))
plot_model_pre(Ridge, alphas=(0, 10**-5, 10**5), solver="cholesky", random_state=42)
#solver="cholesky" 는 숄레스키 분해라고 하는 행렬분해-정규방정식의 해를 구한다.
#solver="sag"는 확률적 평균 경사하강법(Stochastic Average Gradient Descent) 이는 SGD와 비슷하지만 현재 그래디언트와 이전 단계에서 구한 모든 그래디언트를 합해서 평균한 값으로 모델 파라미터를 갱신한다.
plt.ylabel("$y$", rotation=0, fontsize=1)
plt.show()

Pipeline 클래스 활용
- 앞의 코드에서 보듯이 주어진 속성으로부터 다항식 특성벡터로 변환하고 scailing을 적용한 다음 예측기의 입력으로 전달하는 일련의 과정은 정확하고 순서대로 실행되어야 함.
- 연속된 변환을 순서대로 처리하도록 도와주는 sklearn.pipeline 모듈의 Pipeline 클래스를 이용하면 편리함 (API)
- Pipeline은 연속된 단계를 나타내는 이름/변환기(추정기) 쌍의 목록을 입력으로 받는데, 마지막 단계에는
변환기와추정기를 모두 사용할 수 있고, 그 외에는 변환기만 가능 - 이름은 나중에 하이퍼파라미터를 조정할 때 이용
- Pipeline의
fit()메소드를 호출하면 모든 변환기의fit_transform()메소드를 순서대로 호출하면서 해당 단계의 출력을 다음 단계의 입력으로 전달하고, 마지막 단계에서는fit()메소드만 호출함 - Pipeline의 객체는 마지막 추정기와 동일한 메소드를 제공함
Pipeline 클래스 실습
from sklearn.pipeline import Pipeline #Pipeline 불러오기

def plot_model(model_class, alphas, **model_kargs):
    for alpha, style in zip(alphas, ("b-", "g-", "r-")):
        model = model_class(alpha, **model_kargs) if alpha > 0 else LinearRegression()

        model = Pipeline([
                    ("poly_features", PolynomialFeatures(degree=10, include_bias=False)),
                    ("std_scaler", StandardScaler()),
                    ("regul_reg", model),
                ]) #앞의 코드와 같은 코드이다. Pipeline 이용해서 작성할 수 있다.
        model.fit(X, y) #마지막은 fit() ,앞선 모든 변환기는 fit_transform()
        y_new_regul = model.predict(X_new)
        plt.plot(X_new, y_new_regul, style, linewidth=1, label=r"$\alpha = {}$".format(alpha))

    plt.plot(X, y, "b.", linewidth=3)
    plt.plot(X_new,y_new, "m.", linewidth=3, alpha=0.3)
    plt.plot(X_new, 1+0.3*X_new, "m--", linewidth=1)
    plt.legend(loc="upper left", fontsize=10)
    plt.xlabel("$x_1$", fontsize=10)
    plt.axis([0, 3, 0.5, 2])

plt.figure(figsize=(5,5))
plot_model(Ridge, alphas=(0, 10**-5, 10**5), random_state=42)
plt.ylabel("$y$", rotation=0, fontsize=1)
plt.rcdefaults()
plt.show()
위와 동일한 그래프가 그려진다.
릿지 회귀에서 규제 정도를 조절하는 하이퍼파라미터
-
하이퍼 파라미터 $\alpha$ 의 조정: 교차검증을 통해
-
sklearn.linear_model 모듈의 RidgeCV 클래스를 이용하면 최적의 $\alpha$에 대한 Ridge 추정기를 쉽게 얻을 수 있음 (API)
-
성능평가 기준은 입력변수
scoring에 문자열로 전달- sklearn에서 score는 큰 값이 좋은 것으로 구현되어 있으므로 MSE로 평가하려면 ‘neg_mean_squared_error’, R2로 평가하려면 ‘r2’를 전달
- 그 외 scoring에 전달할 수 있는 문자열과 대응되는
sklearn.metrics모듈의 함수는 다음 링크의 3.3.1.2를 참고 (API)
- $\alpha$ 조정 예시
my_tr = Pipeline([
                ("poly_features", PolynomialFeatures(degree=10, include_bias=False)),
                ("std_scaler", StandardScaler())])
X_tr = my_tr.fit_transform(X)

from sklearn.linear_model import RidgeCV
clf = RidgeCV(alphas=[1e-4, 1e-3, 1e-2, 1e-1, 1, 1e2, 1e3], scoring="r2").fit(X_tr, y)
clf.alpha_  #0.1

clf = RidgeCV(alphas=[0.05, 0.1, 0.5], scoring="r2").fit(X_tr, y)
clf.alpha_  #0.5

clf = RidgeCV(alphas=[0.1, 0.3, 0.5, 0.6], scoring="r2").fit(X_tr, y)
clf.alpha_ #0.3

clf = RidgeCV(alphas=[0.25, 0.3, 0.35], scoring="r2").fit(X_tr, y)
clf.alpha_ #0.3 #계속 범위를 줄여 나간다. 더 줄일 수 있지만 이 정도에서 마무리한다.


clf.predict(my_tr.transform(X_new[:5]))
#array([[1.0350755 ],
       [1.04196859],
       [1.04887989],
       [1.05580933],
       [1.06275684]])

clf.coef_, clf.intercept_ #가중치 ,편향

#(array([[ 2.04383040e-01,  2.75877253e-02, -2.34940881e-03,
         -8.88173617e-03, -9.55326984e-03, -6.38695956e-03,
          1.88318873e-05,  8.98776960e-03,  1.97985145e-02,
          3.17796667e-02]]),
#array([1.38465065]))


clf.best_score_ #제일 좋은 스코어
#0.8660278843491014


plt.figure(figsize=(4,4))
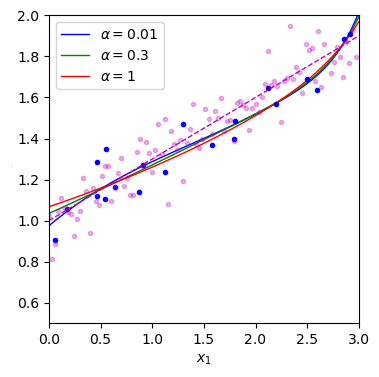
plot_model(Ridge, alphas=(1e-2, 0.3, 1), random_state=42)
plt.ylabel("$y$", rotation=0, fontsize=1)
plt.show() # alpha 값에 따른 그래프

라쏘 회귀 (Lasso regression)
-
라쏘회귀의 경우에 릿지회귀의 경우와 달리 손실함수가 최소가 되는 $\theta$를 해석적으로 구할 수 없으므로 경사하강법 또는 좌표별하강법(coordinate descent)를 이용
\[f(\theta)\ge f(\theta_0)+\mathbf v^{\rm T}(\theta-\theta_0)\text{ for all }\theta\in \mathbb R^n\]- 라쏘회귀의 손실함수는 $\theta_i=0$ $(i=1,\cdots,n)$에서 미분 가능하지 않지만, 그래디언트 벡터 대신 서브그래디언트(subgradient) 벡터를 이용하면 경사하강법을 적용할 수 있다.
- $f:\mathbb R^n\to \mathbb R$의 $ \theta=\theta_0$에서의 서브그래디언트 벡터 $\mathbf v\in \mathbb R^n$는 다음 조건을 만족시키는 임의의 벡터를 의미한다.
- \[\text{예를 들어} f(\theta)=||\theta||_1=\sum_{i=1}^n|\theta_i|\text{에 대해} (\text{sign}(\theta_1),\cdots,\text{sign}(\theta_n))^{\rm T}\text{는 서브그래디언트 벡터 중 하나가 된다}\]
-
단,
\[\text{sign}(\theta_i)=\begin{cases} 1 &\text{ if }\theta_i>0 \\ 0 &\text{ if }\theta_i=0\\ -1 & \text{ if }\theta_i<0\end{cases}\] -
미분가능한 점에서의 서브그래디언트 벡터는 그래디언트 벡터 뿐이다.
- 함수가 최소가 되는 점에서의 서브그래디언트 벡터 중에는 0이 항상 포함됨
-
좌표별하강법(Coordinate Desecnt): 아래로 볼록한 함수 $f$가 모든 점에서 미분가능하면, $\theta=\mathbf a=(a_1,\cdots,a_n)$에서 $f$가 최소가 된다는 것은 다음 함수 $f_i(t)$가 모두 $t=a_i$에서 최소가 된다는 것과 동치이다.
\[\begin{align} f_1(t)=f(t,a_2,a_3,&\cdots,a_n)\\ f_2(t)=f(a_1,t,a_3,&\cdots,a_n)\\ \vdots\\ f_n(t)=f(a_1,\cdots,&a_{n-1},t) \end{align}\] -
아래로 볼록한 함수 f가 모든 점에서 미분가능하지 않은 경우에는 일반적으로 위 결과가 성립하지 않음
-
하지만, 함수 $f$가 다음과 같이 아래로 볼록한 함수 $g,\ h_i$들의 합 $f(\theta)=g(\theta)+\sum_{i=1}^n h_i(\theta_i)$
이고 $g$가 모든 점에서 미분가능한 함수인 경우에는 $f$가 $\theta=\mathbf a$에서 최소라는 것과 각 좌표축에 대해 최소라는 것이 동치이다. $\cdots\cdots$ (3)
왜냐하면!(클릭)
\(\begin{align} \ f(\theta)-f(\mathbf a) = & g(\theta)-g(\mathbf a)+\sum_{i=1}^n (h_i(\theta_i)-h_i(a_i))\\ \ge &\nabla_{\theta}g(\mathbf a)(\theta -\mathbf a)+\sum_{i=1}^n (h_i(\theta_i)-h_i(a_i))\\ = &\sum_{i=1}^n \left(\dfrac{\partial g}{\partial\theta_i}(\mathbf a)(\theta_i-a_i)+h_i(\theta_i)-h_i(a_i)\right)\ge 0 \end{align}\) 위 부등식의 마지막은 f가 $\theta=\mathbf a$에서 각 좌표축에 최소라는 것으로부터 각 $i=1,\cdots,n$에 대해 $-\dfrac{\partial g}{\partial \theta_i}(\mathbf a)$가 $\theta_i=a_i$에서 $h_i$의 서브그래디언트가 되어 \(h_i(\theta_i)\ge h_i(a_i)-\dfrac{\partial g}{\partial \theta_i}(\mathbf a)(\theta_i-a_i)\) 이 성립하기 때문
-
위 (3)의 상황에서 다음과 같이 반복적으로 각 좌표축을 따라 움직이며 함수의 최솟값을 찾는 최적화 알고리즘을 좌표별하강법이라고 함
-
$\theta^{(0)}$를 임의로 선택한 후 다음과 같이 $\theta^{(k)}$로부터 $\theta^{(k+1)}$로 업데이트
\[\begin{align} \theta_1^{(k+1)} \in\ \text{argmin}_t &f(t,\theta_2^{(k)},\theta_3^{(k)}\cdots,\theta_n^{(k)}) \\ \theta_2^{(k+1)} \in\ \text{argmin}_t &f(\theta_1^{(k+1)},t,\theta_3^{(k)},\cdots,\theta_n^{(k)}) \\ \vdots \\ \theta_n^{(k+1)} \in\ \text{argmin}_t &f(\theta_1^{(k+1)},\cdots,\theta_{n-1}^{(k+1)},t) \end{align}\] -
위의 반복과정에서 각 좌표축 별로 최소가 되는 θi를 구할 때, (서브그래디언트를 이용한) 경사하강법을 적용할 수 있음
-
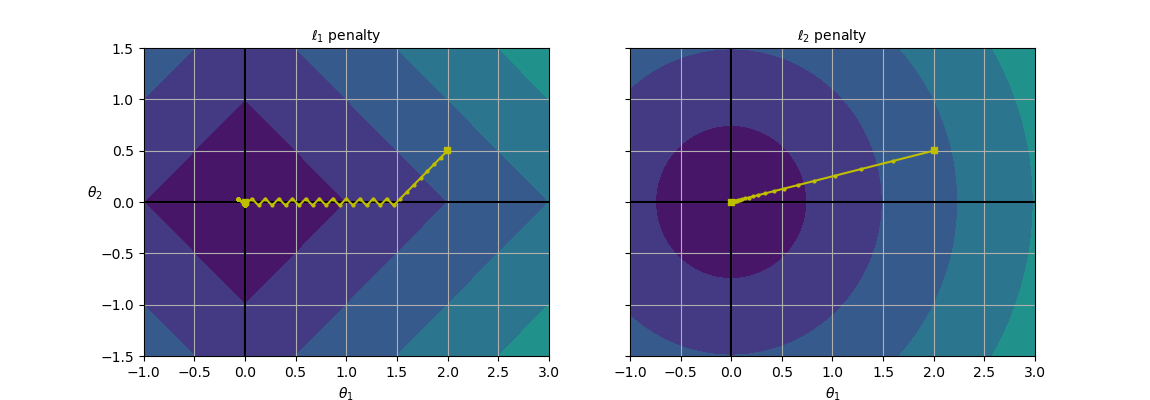
라쏘회귀는 릿지회귀에 비해 덜 중요한 특성의 가중치를 제거하는 경향이 있음: 덜 중요한 특성의 가중치가 1이 됨, 중요한 특성만 선택하는 효과

- 두 경우 모두 $\theta_1=2, \theta_2=0.5$로 초기화하고 경사하강법을 적용하여 각 함수가 최소가 되는 $\theta$를 구하면 $\ell_1$의 경우에는 서브그래디언트 벡터가 $(\text{sign}(\theta_1),\text{sign}(\theta_2))^{\rm T}$이므로 $\theta_2$가 먼저 0이 되고, $\theta_1$이 0이 될 때까지 $\theta_1$ 축을 따라 이동.
- $\ell_2$의 경우에는 그래디언트 벡터가 $2(\theta_1,\theta_2)^{\rm T}$이므로 원점까지 직선을 따라 이동
- 경사하강법의 고정된 학습률에 대해 $\ell_2$의 경우, 원점에 가까워질 수록 업데이트되는 정도가 줄어들면서 수렴. $\ell_1$의 경우에는 학습률을 스케쥴링 하지 않으면 진동 (따라서, 수렴을 시키려면 점진적으로 학습률을 감소시켜야 함)
- 라쏘회귀는 sklearn.linear_model 모듈의 Lasso 클래스(API) 또는 SGDRegressor(penalty=”l1”)을 이용
- 라쏘회귀에서 규제를 조절하는 하이퍼파라미터 $\alpha$를 조정하는 것은 릿지회귀의 경우처럼 교차검증을 이용
- 라쏘회귀에 대한 교차검증을 쉽게 하는 방법은 LassoCV(API)
엘라스틱넷(Elastic Net)
-
일반적으로 규제가 없는 선형회귀보다는 릿지회귀를 적용하지만, 쓰이는 특성이 몇 개뿐이라고 의심될 때는 라쏘회귀 또는 엘라스틱넷을 적용 (라쏘는 변수 선택의 효과가 있기 때문)
-
특성 수가 샘플 수보다 많거나 특성 몇 개가 강하게 연관되어 있을 때(다중공선성 의심) 라쏘회귀가 문제를 일으킬 수 있는데, 이럴 때 엘라스틱넷을 주로 사용
-
sklearn.linear_model 모듈의 ElasticNet 클래스 (API) 또는 SGDRegressor(penalty=”elasticnet”)을 이용
- 엘라스틱넷의 하이퍼파라미터는 규제를 조절하는 α에 해당되는 입력변수
alpha와 ℓ1 페널티와 ℓ2 패널티를 결합하는 비율을 결정하는 r에 해당되는 입력변수l1_ratio를 교차검증을 통해 선택해야 함
- 엘라스틱넷의 하이퍼파라미터는 규제를 조절하는 α에 해당되는 입력변수
#간단한 엘라스틱넷의 예시
from sklearn.linear_model import ElasticNet
elastic_net = ElasticNet(alpha=0.1, l1_ratio=0.5, random_state=42)
elastic_net.fit(X, y)
elastic_net.predict([[1.5]])
객체를 생성후 하이퍼파라미터를 수정하는 방법
- SGDRegressor
,Ridge,Lasso,ElasticNet의 객체를 생성한 후 파라미터를 수정하기 위해서는 생성된 객체의 set_params(**kwargs) 메소드를 이용하면 됨. - SGDRegressor
,Ridge,Lasso,ElasticNet의 객체를 학습시킨 후(fit) 성능지표로 $R^2$을 계산하기 위해서는 학습된 객체의 score(X, y) 메소드를 이용하면 됨. Ridge나Lasso의 경우처럼ElasticNetCV를 이용하여 규제를 조절하는 ‘alpha’ 하이퍼파라미터를 검증 데이터셋으로 선택할 수 있음(API)
import numpy as np

np.random.seed(42)
m = 20   # 데이터 수
X = 3 * np.random.rand(m, 1)  # 0~1 난수*3
y = 1 + 0.5 * X + np.random.randn(m, 1) / 1.5   # 1차방정식 형태
X_new = np.linspace(0, 3, 100).reshape(100, 1)  # 0~3사이 100개

#릿지회귀
from sklearn.linear_model import Ridge

ridge_reg = Ridge(alpha=1,
                 solver="cholesky",
                 random_state=42)
ridge_reg.fit(X,y)
ridge_reg.predict([[1.5]])
조기 종료(Early Stopping)
-
경사하강법과 같이 반복적인 학습 알고리즘을 규제하는 또 다른 방식은 검증에러가 최솟값(검증 성능이 최댓값)에 도달하면 바로 훈련을 중지시키는 것으로 조기 종료라고 함
-
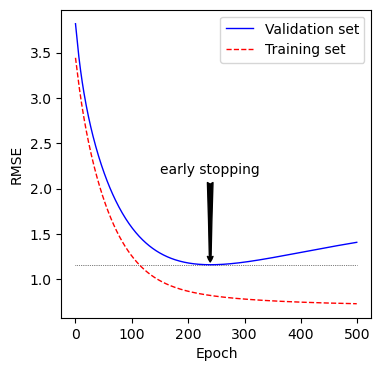
보통 학습 에포크가 진행됨에 알고리즘이 점차 학습되어 훈련 데이터셋에 대한 오차와 검증 데이터셋에 대한 오차가 모두 줄어들다가, 검증 오차는 다시 상승하기 시작함 (과대적합이 되기 시작)
-
조기종료는 검증 오차가 최소에 도달하는 즉시 학습을 멈추는 것
-
확률적 경사하강법이나 미니배치 경사하강법과 같이 불규칙하게 움직이며 수렴해가는 경우는 검증 오차가 최솟값에 도달했는지를 확인하기 쉽지 않음
- 검증 오차가 일정 시간 동안 현재까지의 최솟값보다 클 때, 학습을 멈추고 검증 에러가 최소였을 때의 모델 파라미터로 되돌리는 것으로 극복
-
손실함수 $f$가 최소가 되는지를 확인하는 방법
조기 종료 실습
SGDRegressor에서warm_start=True로 설정하면fit()메소드가 호출될 때 처음부터 다시 학습을 시작하지 않고 이전 모델 파라미터에서 훈련을 이어감- 학습률에 대한 스케쥴링을 하지 않고 규제없이 조기종료를 이용하여 학습을 시켜보자.(
penalty=None,learning_rate="constant") - 학습된 추정기를 복사하는 방법: sklearn.base 모듈의 clone을 이용 (API)
- 그림에 화살표를 이용하여 주석을 다는 법: plt.annotate()를 이용 (API)
from sklearn.model_selection import train_test_split
from sklearn.metrics import mean_squared_error
from sklearn.base import clone  # 학습된 예측기를 복사

# 데이터셋 생성
np.random.seed(42)
m = 100
X2 = 6 * np.random.rand(m, 1) - 3
y2 = 2 + X2 + 0.5 * X2**2 + np.random.randn(m, 1)

# 데이터셋 나누기
X2_train, X2_val, y2_train, y2_val= train_test_split(X2[:50],y2[:50].ravel(), test_size=0.5, random_state=10)

# 90차 다항식 특성벡터로 확장하고 스케일링
poly_scaler = Pipeline([
        ("poly_features", PolynomialFeatures(degree=90, include_bias=False)),#x0은 제외
        ("std_scaler", StandardScaler())
    ])

X2_train_poly_scaled = poly_scaler.fit_transform(X2_train)
X2_val_poly_scaled = poly_scaler.transform(X2_val)

# 추정기 객체 생성 (`penalty=None`, `learning_rate="constant"`)
sgd_reg = SGDRegressor(max_iter=1, tol= -np.infty, warm_start=True, #fit() 메소드 호출마다 기존 유지
                       penalty=None, learning_rate="constant", eta0=0.0005, random_state=42)

minimum_val_error = float("inf") #초기 검증 오차 무한대로 지정

best_epoch = None
best_model = None

n_epochs = 1000
time_limit = 5
time_ctr = 0

for epoch in range(n_epochs):
    sgd_reg.fit(X2_train_poly_scaled, y2_train)  # 연속적으로 fit() 메소드 호출
    y2_val_predict = sgd_reg.predict(X2_val_poly_scaled) #검증 세트 훈련
    val_error = mean_squared_error(y2_val, y2_val_predict) # 검증 세트 mse
    time_ctr += 1
    if val_error < minimum_val_error: #검증오차 계속 비교하며 최적 단계, 모델 찾기
        minimum_val_error = val_error
        best_epoch = epoch
        best_model = clone(sgd_reg)
        time_ctr = 0
    if time_ctr >= time_limit:
        break

print(f"best epoch:{best_epoch}")
#best epoch:239

# 위에서 얻은 결과를 그림으로 그리기
sgd_reg = SGDRegressor(max_iter=1, tol= -np.infty, warm_start=True,
                       penalty=None, learning_rate="constant", eta0=0.0005, random_state=42)

n_epochs = 500 #반복횟수
train_errors, val_errors = [], []
for epoch in range(n_epochs):
    sgd_reg.fit(X2_train_poly_scaled, y2_train)
    y2_train_predict = sgd_reg.predict(X2_train_poly_scaled)
    y2_val_predict = sgd_reg.predict(X2_val_poly_scaled)
    train_errors.append(mean_squared_error(y2_train, y2_train_predict))
    val_errors.append(mean_squared_error(y2_val, y2_val_predict))

best_epoch = np.argmin(val_errors)
best_val_rmse = np.sqrt(val_errors[best_epoch])

plt.figure(figsize=(4,4))
###################################################
# 주석달기
plt.annotate('early stopping',
             xy=(best_epoch, best_val_rmse),
             xytext=(best_epoch, best_val_rmse + 1),
             ha="center",
             arrowprops=dict(facecolor='black', arrowstyle='fancy'),
             fontsize=10
            )

plt.plot([0, n_epochs], [best_val_rmse, best_val_rmse], "k:", linewidth=0.5)
plt.plot(np.sqrt(val_errors), "b-", linewidth=1, label="Validation set")
plt.plot(np.sqrt(train_errors), "r--", linewidth=1, label="Training set")
plt.legend(loc="upper right", fontsize=10)
plt.xlabel("Epoch", fontsize=10)
plt.ylabel("RMSE", fontsize=10)
plt.show()

- 그래프에서 보면 검증 세트는 알고리즘이 학습되면서 RMSE는 감소하면서 최솟값에 도달했다가 상승한다. 이는 과대적합이 되고 있다는 증거임
- SGD나 미니배치 경사하강법은 비용함수의 곡선이 매끄럽지 않아 최솟값에 도달햇는지 확인이 어려울 수 있음
- 검증오차가 일정 횟수 동안 최솟값보다 클 때 모델이 더 개선되지 않는다고 판단해 학습을 멈추고 최소였던 검증오차로 되돌아가는 방법을 사용할 수 있음
Reference:
- 기계학습_하길찬 교수님 수업을 듣고 공부한 내용입니다.
- args와 kwargs 에 관한 개미님의 글
-
Lasso, Ridge 에 관한 ratsgo님의 깃헙
- Lasso, Ridge 에 관한 신용근님의 깃헙 블로그