로지스틱 회귀(Logistic Regression) 의 학습 모델
-
레이블이 1, 0인 두 개의 클래스에 대한 분류문제에서 샘플이 특정 클래스에 속할 확률을 추정하는 지도학습의 한 가지
-
선형회귀 모델과 같이 입력 특성의 가중치의 합(편향 포함) $\theta^{\rm T}\mathbf x = \theta_0+\theta_1 x_1+\cdots +\theta_nx_n$을 계산한 다음 시그모이드 함수(sigmoid) $\sigma(t)=\dfrac{1}{1+\exp(-t)}$를 취한 값 $\sigma (\theta^{\rm T} \mathbf x)$를 ${\rm P}(Y=1 \mid X= \mathbf x)$ 에 대한 추정값 $\hat p(\mathbf x)$로 추정하는 모델.
-
즉, 모델 파라미터 ${\theta}=(\theta_0,\cdots,\theta_n)^{\rm T}$에 대한 로지스틱 회귀 모델을 $h_{\theta}$라 할 때
\[\hat p(\mathbf x) = h_{\theta}(\mathbf x)= \sigma({\theta}^{\rm T}\mathbf x) =\dfrac{1}{1+\exp(-{\theta}^{\rm T}\mathbf x)}=\dfrac{1}{1+\exp(-(\theta_0+\theta_1x_1+\cdots+\theta_n x_n))} \cdots(1)\] -
시그모이드 함수를 생각하는 이유:
- 확률 $0<p<1$에 대해 오즈(odds) $\dfrac{p}{1-p}$는 $(0,\infty)$사이의 값을 가지므로 로그-오즈(log-odds) 또는 로짓이라 부르는 $\ln \left(\dfrac{p}{1-p}\right)$는 $(-\infty, \infty)$ 사이의 값을 가짐
- 이 로짓을 선형모델로 추정하는 것이 로지스틱 회귀모델. 즉, $\ln (\dfrac{p}{1-p})=\theta^{\rm T}\mathbf x$으로부터 $p$를 구하면 식(1)이 나옴
-
로지스틱 회귀 모델을 통한 레이블의 예측:
-
샘플 $\mathbf x$가 양성 클래스(y=1)에 속할 확률 $\hat p(\mathbf x)=h_{\theta}(\mathbf x)$를 추정한 후 다음과 같이 예측 $\hat y$를 구함
\[\hat y = \begin{cases} 0 & \text{ if }& \hat p(\mathbf x)<0.5\\ 1 &\text{ if }& \hat p(\mathbf x)\ge0.5 \end{cases}\]
-
시그모이드 함수 그려보기
import numpy as np
import matplotlib.pyplot as plt
%matplotlib inline

def sigmoid(x):
    return 1/(1+np.exp(-x))

xlist = np.linspace(-10,10,1000)
ylist = sigmoid(xlist)

plt.plot(xlist,ylist, label=r"$\sigma (t)=\dfrac{1}{1+\exp(-t)}$")

plt.plot([-10,10],[0.5,0.5], 'r--', linewidth=0.6)
plt.plot([-10,10],[1,1], 'r--', linewidth=0.6)
plt.plot([-10,10],[0,0], 'r--', linewidth=0.6)
plt.plot([0,0],[0,1],'r--', linewidth=0.6)

plt.legend(loc="upper left", fontsize=10)

로지스틱 회귀모델의 학습
-
훈련 데이터셋 ${(\mathbf x_i,y_i) \mid1\le i \le m}$이 주어질 때, 다음과 같이 정의되는 로지스틱 회귀의 비용함수(로그손실 함수)
\[J(\theta) = -\dfrac 1 m \sum_{i=1}^m (y_i \ln p_i + (1-y_i)\ln (1-p_i)) \\ (단, p_i= \sigma({\theta}^{\rm T}\mathbf x_i)) \cdots (2)\]가 최소가 되는 모델 파라미터 $\theta$를 구하는 것
\[\begin{align} J(\theta)=& -\dfrac 1 m \ln\left(\prod_{i=1}^m p_i^{y_i} (1-p_i)^{(1-y_i)}\right) \\ =& -\dfrac 1 m \ln\left(\text{P}(Y_1=y_1,\cdots,Y_m=y_m|X_1=\mathbf x_1,\cdots,X_m=\mathbf x_m :\theta\right) \end{align}\]- $\text{P}(Y_i=1 \mid X=\mathbf x_i)=p_i$이므로 $\text{P}(Y_i=0 \mid X=\mathbf x_i)=1-p_i$이고 훈련 데이터셋은 iid 확률변수 $(X_i,Y_i)$ $(1\le i \le m)$에 대한 값이므로 로지스틱 회귀 모델에 대한 비용함수가 최소가 되는 $\theta$를 구하는 것은 $\theta$에 대한 로그우도함수 $\ell(\theta)= \ln(\text{P}(y_1,\cdots,y_m \mid \mathbf x_1,\cdots,\mathbf x_m:{\theta}))$가 최대가 되는 $\theta$를 구하는 것과 같다.
- 비용함수 $J(\theta)$는 $\theta$에 대해 아래로 볼록한 함수이므로 최솟값이 존재함을 보장할 수 있지만, 정규방정식처럼 해를 구하는 공식은 없음
-
경사하강법 또는 다른 최적화 알고리즘을 이용하여 해의 근삿값을 구함 (
sklearn.linear_model모듈의LogisticRegression의solver참고) -
배치 경사하강법을 적용할 때 비용함수에 대한 그래디언트 벡터 $\nabla_{\theta}J(\theta)$ : 각 $i$ ($1\le i\le m)$에 대해 $\nabla_\theta J(\theta)$의 $j$번째 성분은
\[\dfrac{\partial}{\partial \theta_j} J(\theta)= \dfrac 1 m \sum_{i=1}^m (\sigma({\theta}^{\rm T}\mathbf x_i)-y_i)x_{ij},\\ \mathbf x_i=(1,x_{i1},\cdots,x_{in})\]
-
sklearn.linear_model모듈의LogisticRegressionAPI 또는 확률적 경사하강법을 이용하는sklearn.linear_model모듈의SGDClassifierAPI를 사용(이 경우loss="log"로 설정해야 로지스틱 회귀)-
다른 선형회귀 모델처럼 로지스틱 회귀 모델도 $\ell_1$, $\ell_2$ 규제항을 사용하여 규제할 수 있으며
LogisticRegression은 $\ell_2$ 페널티를 기본으로 함 (penalty="l2",penalty="none"과 같이 사용) -
규제가 있는
SGDClassifier(loss='log')모델의 경우 선형회귀 모델(SGDRegressor)의 경우처럼 규제를 조절하는 하이퍼파라미터가alpha이지만,LogisticRegression의 경우에는alpha의 역수에 해당하는C가 규제를 조절하는 하이퍼파라미터
- C의 기본값은 1, C가 커지면 규제가 작아지고, C가 작아지면 규제가 커짐
-
-
로지스틱 회귀 모델로 LogisticRegression을 사용하는 경우
-
최적화에 사용되는 알고리즘은
solver를 통해 선택할 수 있으며 기본값은solver="lbfgs"(선택한 페널티 항에 대해 사용할 수 있는 최적화 알고리즘에 제한이 있으므로 자세한 내용은 위 API를 참고)- 최적화: 최소, 최대를 구하는 것 , 최대를 구하는 것에 음수를 취하면 최소를 구하는 것과 같아짐
-
이진 분류가 아닌 경우, 즉, 클래스의 종류가 $3$이상일 때는 입력변수
multi_class를multi_class="multinomial"로 두면 뒤에 설명할 소프트맥스 회귀 모델이 됨multi_class="ovr"이면 일대다 전략을 사용
-
학습 후 예측은
predict메소드를 이용하고, 확률값은predict_proba메소드를 이용
-
학습된 객체의
score메소드는 정확도(accuracy)를 사용
-
로지스틱 회귀 실습
-
데이터셋: sklearn의 datasets에 포함된 iris dataset
- Setosa, Versicolor, Virginica 세 품종의 붓꽃 150개에 대한 꽃잎(petal), 꽃받침(sepal)의 너비와 길이를 담고 있는 데이터셋
- UCI Machine Learning Repository
# 데이터셋 로드
from sklearn import datasets
iris = datasets.load_iris()

# 로드된 데이터셋은 일종의 dictionary 형태
iris.keys()
#dict_keys(['data', 'target', 'frame', 'target_names', 'DESCR', 'feature_names', 'filename'])

print(iris["DESCR"]) # 데이터에 대한 정보

iris["feature_names"]
#['sepal length (cm)', 꽃받침 길이
#'sepal width (cm)', 꽃받침 너비
# 'petal length (cm)', 꽃잎 길이
#'petal width (cm)'] 꽃잎 너비

iris["target_names"]
#array(['setosa', 'versicolor', 'virginica'], dtype='<U10')
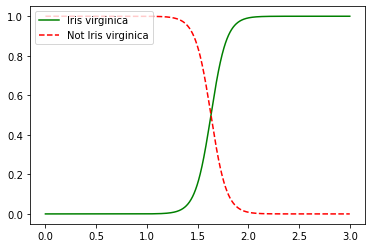
#꽃잎의 너비를 이용하여 virginica를 판별하는 로지스틱 회귀 모델 # 꽃잎의 너비(petal)을 이용하여 virginica이면 레이블 1, 아니면 레이블 0이 되도록 학습 X = iris["data"][:,3:] y = (iris["target"] == 2).astype(np.int) from sklearn.linear_model import LogisticRegression log_reg = LogisticRegression(penalty="none") log_reg.fit(X,y) plt.plot(X_new, y_new_proba[:, 1], "g-", label="Iris virginica") plt.plot(X_new, y_new_proba[:, 0], "r--", label="Not Iris virginica") plt.legend(loc="upper left", fontsize=10)
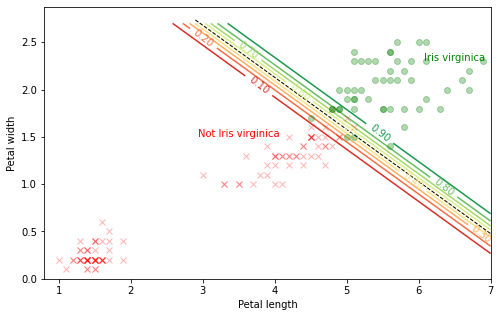
X2 = iris["data"][:, 2:]  # 꽃잎의 길이, 너비
y2 = (iris["target"] == 2).astype(np.int)

log_reg2 = LogisticRegression(C=10**10, random_state=42)
log_reg2.fit(X2, y2)

# 그림을 그리기 위한 작업
x0, x1 = np.meshgrid(
        np.linspace(0.8, 7, 800).reshape(-1, 1), # 800x1 행렬화
        np.linspace(0, 2.7, 400).reshape(-1, 1),
    )

X2_new = np.column_stack([x0.ravel(), x1.ravel()])

y2_proba = log_reg2.predict_proba(X2_new)

plt.figure(figsize=(8, 5))
plt.plot(X2[y2==0, 0], X2[y2==0, 1], "rx", alpha=0.3)
plt.plot(X2[y2==1, 0], X2[y2==1, 1], "go", alpha=0.3)

zz = y2_proba[:, 1].reshape(x0.shape)
contour = plt.contour(x0, x1, zz, levels=9, cmap=plt.cm.RdYlGn)

# 확률이 0.5인 결정 경계 계산
left_right = np.array([2.9, 7])
boundary = -(log_reg2.coef_[0][0] * left_right + log_reg2.intercept_[0]) / log_reg2.coef_[0][1]

# 등위선에 대응되는 확률값 표시
plt.clabel(contour, inline=1, fontsize=10, fmt='%1.2f')
plt.plot(left_right, boundary, "k--", linewidth=1)
plt.text(3.5, 1.5, "Not Iris virginica", fontsize=10, color="r", ha="center")
plt.text(6.5, 2.3, "Iris virginica", fontsize=10, color="g", ha="center")
plt.xlabel("Petal length", fontsize=10)
plt.ylabel("Petal width", fontsize=10)
# plt.axis([2.9, 7, 0.8, 2.7])
plt.show()
소프트맥스 회귀(Softmax Regression)의 학습 모델
- 다중 클래스에 대한 분류 문제에서 샘플이 특정 클래스에 속할 확률을 추정하는 지도학습의 한 가지
2개의 클래스에 대한 이진 분류기를 여러 개 사용하여 다중 분류문제에 대한 분류기를 만들 수 있음
일대다 전략(OvR(One versus the Rest) 또는 OvA(One versus All) 전략)
:한 개의 클래스만 양성, 나머지는 음성으로 분류하는 이진 분류기를 클래스의 개수만큼 학습시킨 후, 주어진 샘플이 각 분류기에 대해 양성이 될 확률값을 계산하고 이 확률값이 가장 큰 클래스로 분류하는 방법
일대일 전략(OvO(One versus One) 전략)
:주어진 $K$개의 클래스 중에서 $2$개의 클래스 조합마다 이진 분류기를 학습시켜 총 $K(K-1)/2$개의 학습된 이진분류기 만들고, 주어진 샘플에 대해 $K(K-1)/2$개의 분류기에 대한 레이블을 구해서 가장 많이 양성으로 분류된 클래스를 선택하는 방법
-
소프트맥스 회귀 모델
-
3개 이상의 클래스 분류 모델
-
소프트맥스 회귀 모델 과정
- A,B,C 라벨 분류를 한다고 하면, 각각의 WX (가중치와 입력값의 회귀식의 곱,1X3)가 3가지가 필요하다. 이는 너무 복잡하므로 가중치를 하나의 행렬(3X3)로 묶어서 WX를 예측값을 구한다.
- 예측값을 총합이 1인 확률 분포로 바꾸기 위해 소프트맥스 함수를 이용
- 교차 엔트로피 함수로 원핫인코딩 (한 클래스만 1을 주고 나머지는 0으로 채우는 것)
-
소프트맥스 회귀 모델 수식으로 이해하기
훈련 데이터셋 ${(\mathbf x_i,y_i) \mid 1\le i \le m}$이 주어질 때 (단, 가능한 레이블의 종류는 $K$ 가지이고, $\mathbf x_i=(1,x_{i1},\cdots,x_{in})^{\rm T}$)
-
(1) $K$ 개의 클래스 각각에 대해 모델 파라미터 $\theta_k=(\theta_{k0},\theta_{k1},\cdots,\theta_{kn})^{\rm T}$ ($k=1,2,\cdots,K$)를 이용하여 샘플 $\mathbf x$의 클래스 $k$에 대한 점수(score) $s_k(\mathbf x)=\theta_k^{\rm T}\mathbf x$를 계산하고,
이때, 각 클래스 $k$에 대한
- 점수를 성분으로 갖는 벡터를 $\mathbf s(\mathbf x)=(s_1(\mathbf x),\cdots,s_K(\mathbf x))^{\rm T}$라 하고, $\theta_k$를 행벡터로 갖는 $k\times (n+1)$ 행렬을 $\mathbf \Theta = (\theta_{ij})$라고 함
- (2) $\mathbf t=(t_1,\cdots,t_K)^{\rm T}\in \mathbb R^K$에 대해 소프트맥스 함수 $\sigma: \mathbb R^K\to [0,1]^K$를 다음과 같이 정의할 때
\[\sigma(\mathbf t) = \left(\dfrac{\exp(t_1)}{\sum_{k=1}^K \exp(t_k)},\cdots,\dfrac{\exp(t_K)}{\sum_{k=1}^K \exp(t_k)}\right)^{\rm T}\]
- $\sigma(\mathbf t)$의 $i$번째 성분을 $\sigma(\mathbf t)_i$라 할 때
\[\sigma(\mathbf t)_1+\cdots + \sigma(\mathbf t)_K=1\]
- (3) 클래스 $k$에 속할 확률 $\hat p_k(\mathbf x)$를 다음과 같이 추정 (오해의 소지가 없을 때는 $\hat p_k(\mathbf x)$를 간단히 $\hat p_k$로 나타냄)
\[\hat{p}_k = \sigma(\mathbf s(\mathbf x))_k= \dfrac{\exp(s_k(\mathbf x))}{\sum_{i=1}^K \exp(s_i(\mathbf x))}\]
-
(4) 샘플 $\mathbf x$에 대한 레이블의 예측은 추정확률 $\hat{p}_k$가 최대가 되는 $k$로 예측 즉,
\[\hat y = \text{argmax}_k \hat{p}_k=\text{argmax}_k \sigma(\mathbf s(\mathbf x))_k=\text{argmax}_k s_k(\mathbf x) = \text{argmax}_k \theta_k^{\rm T}\mathbf x, \ (1\le k\le K)\]
- 소프트맥스 회귀 분류기는 하나의 샘플에 대해 하나의 클래스만 예측 (즉, 하나의 사진에서 여러 사람의 얼굴을 인식하는 것과 같은 다중 출력 분류기는 아님)
-
소프트맥스 회귀 모델의 학습
- 소프트맥스 회귀 모델에서 레이블이 $k$가 확률의 추정값은 $\hat p_k(\mathbf x)=\text{P}(Y=k \mid X=\mathbf x)$이고 훈련 데이터셋이 iid로부터 얻은 샘플이므로 로그우도함수
\[\ln(\text{P}(y_1,\cdots,y_m\mid \mathbf x_1,\cdots,\mathbf x_m:\mathbf \Theta))=\sum_{i=1}^m \ln(\text{P}(Y=y_i \mid X=\mathbf x_i:\mathbf \Theta))\]
가 최대가 되는 모델 파라미터 $\mathbf \Theta=(\theta_{ij})$를 구하는 것이 소프트맥스 회귀 모델의 학습
-
$i$번째 샘플에 대한 레이블 $y_i\in {1,\cdots,K}$를 원-핫(one hot)인코딩으로 표현하여 레이블 값에 해당하는 한 성분만 $1$이고 나머지 성분은 모두 $0$인 벡터 $(y_{i1},\cdots,y_{iK})^{\rm T}$로 생각하면 (즉, $K=4$이고 $y_i=2$인 경우 $y_i$의 원-핫 인코딩은 $(0,1,0,0)^{\rm T}$)
\[\text{P}(Y=y_i|X=\mathbf x_i:\mathbf \Theta)=\prod_{k=1}^K \hat{p}_k(\mathbf x_i)^{y_{ik}}=\prod_{k=1}^K (\sigma(\mathbf \Theta\mathbf x_i)_k)^{y_{ik}}=\prod_{k=1}^K \left(\dfrac{\exp(\theta_k^{\rm T}\mathbf x_i)}{\sum_{k=1}^K \exp(\theta_k^{\rm T}\mathbf x_i)} \right)^{y_{ik}}\]
- 즉, 소프트맥스 회귀 모델에 대한 비용함수 $J(\mathbf \Theta)$는 위 로그우도함수의 부호를 바꾸고 모든 샘플에 대한 평균을 구하여 다음과 같이 정의함
\[J(\mathbf \Theta)=-\dfrac 1 m \sum_{i=1}^m\sum_{k=1}^K y_{ik}\ln(\hat{p}_k(\mathbf x_i))=-\dfrac 1 m \sum_{i=1}^m\sum_{k=1}^K y_{ik}\ln(\dfrac{\exp(\theta_k^{\rm T}\mathbf x_i)}{\sum_{k=1}^K \exp(\theta_k^{\rm T}\mathbf x_i)} )\]
- 위에서 정의한 비용함수 $J(\mathbf \Theta)$를 크로스 엔트로피(cross entropy) 비용함수라고 부름
- 크로스 엔트로피는 정보이론에서 유래한 것으로 두 이산확률분포 $p: P(X=k)=p_k\ (1\le k\le K)$와 $q: P(X=k)=q_k\ (1\le k\le K)$에 대한 크로스 엔트로피는 $H(p,q)=-\sum_{k=1}^K p_k \ln q_k$로 정의됨
- 일반적으로 두 이산확률분포 $p, \ q$가 어느 정도 비슷한 분포인지에 대한 측도인 쿨백-라이블러 발산(Kullback-Leibler divergence) $K(p | q)$는 $K(p | q)=H(p,q)-H(p,p)$로 정의되고 항상 $K(p | q)\ge 0$이 성립함
- 다음과 같이 계산되는 그래디언트 벡터 $\nabla_{\mathbf \theta}J(\mathbf \Theta)$를 이용하여 경사하강법 또는 다른 최적화 알고리즘을 이용하여 크로스 엔트로피 비용함수가 최소가 되는 모델 파라미터 $\mathbf \Theta$를 구함
- 위 식을 이용하여 각 파라미터 벡터 $\theta_k$ $(k=1,\cdots,K)$를 업데이트 시킴
sklearn.linear_model모듈의LogisticRegression클래스를 이용하여 소프트맥스 회귀 분류기 객체를 생성하기 위해서는 입력변수를multi_class="multinomial"로 전달하면 되고, 사용가능한 최적화 알고리즘은 API의solver에 대한 설명을 참고
- 소프트맥스 회귀를 위한
solver는 뉴턴 켤레 기울기법을 구현한 “newton-cg”, 확률적 평균 경사하강법을 구현한 “sag”, “sag”를 개선한 “saga”, 제한된 메모리 공간에서 의사 뉴턴 방법의 일종을 구현한 “lbfgs”을 사용할 수 있음 - 이 중 $\ell_1$ 규제까지 지원하는 최적화 알고리즘은 “saga”
- 소프트맥스 회귀 모델을 위해
LogisticRegression(multi_class="multinomial")로 생성된 객체를 학습시킨 후,predict,predict_proba,score등의 메소드를 사용하는 것은 로지스틱 회귀의 경우와 같음
소프트맥스 회귀 실습
-
주의할 점
- 다음과 같이 소프트맥스 함수 softmax_pre([$t_1,\cdots,t_n$])을 구현하면 universal function으로 완벽하게 구현된 것처럼 보이지만, $t_i$ 값이 $710$이상인 경우 $e^{710}$가 너무 큰 수(overflow)가 되어 처리할 수 없는 수가 되므로 원하는 결과를 얻을 수 없다.
- 간단한 지수법칙을 이용하여 구현하면 해결 가능하다.
def softmax_pre(x): # x는 넘파이 배열
    x = np.exp(x)
    return x/x.sum() # 소프트맥스 함수 구현

# overflow가 생기지 않는 경우
x1 = np.array([709, 3, 4, 100])
print(softmax_pre(x1))
print(np.round(1e3 * softmax_pre(x1))/1e3)  #e^710 이상이 아니라서 overflow 안생김

#[1.00000000e+000 2.44396947e-307 6.64339780e-307 3.27084919e-265]
#[1. 0. 0. 0.]

# overflow가 생기는 경우
x2 = np.array([800, 3, 4, 100])
print(softmax_pre(x2))
print(np.round(1e3 * softmax_pre(x2))/1e3)

#[nan  0.  0.  0.]
#[nan  0.  0.  0.]
#<ipython-input-50-814dc8c6b251>:2: RuntimeWarning: overflow encountered in exp
 # x = np.exp(x)
#<ipython-input-50-814dc8c6b251>:3: RuntimeWarning: invalid value encountered in true_divide
  #return x/x.sum()
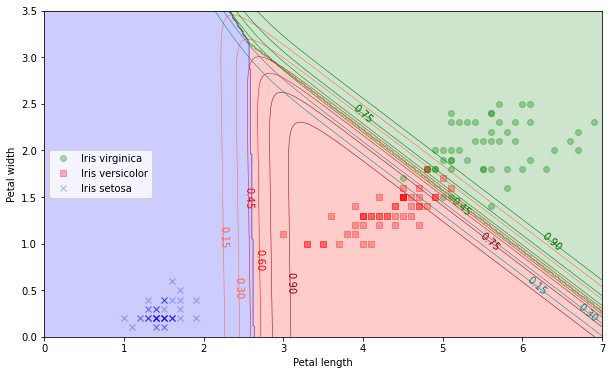
#overflow 수정 #지수가 커질수록 급격하게 커지기 때문에 overflow 발생한다. #원소에 어떤 수를 더해서 지수함수를 취하더라도 결과값이 같다는 softmax의 성질 이용 def softmax(x): x = x - np.max(x) #최대값 뺴주고 계산 x = np.exp(x) return x/x.sum() x3 = np.array([10**19, 790, 800, 100]) print(softmax(x3)) print(np.round(1e3 * softmax(x3))/1e3) #[1. 0. 0. 0.] #[1. 0. 0. 0.]#꽃잎 길이, 너비를 이용한 소프트 맥스 회귀 모델 X = iris["data"][:, 2:] # 꽃잎 길이, 꽃잎 너비 y = iris["target"] softmax_reg = LogisticRegression(multi_class="multinomial",solver="lbfgs", C=10, random_state=42) softmax_reg.fit(X, y) #제한된 메모리 공간에서 의사 뉴턴 방법의 일종을 구현한 "lbfgs" # 결정 경계를 그림으로 나타내기 x0, x1 = np.meshgrid( np.linspace(0, 8, 500).reshape(-1, 1), np.linspace(0, 3.5, 200).reshape(-1, 1), ) X_new = np.column_stack([x0.ravel(), x1.ravel()]) y_proba = softmax_reg.predict_proba(X_new) y_predict = softmax_reg.predict(X_new) zz2 = y_proba[:, 2].reshape(x0.shape) zz1 = y_proba[:, 1].reshape(x0.shape) zz = y_predict.reshape(x0.shape) plt.figure(figsize=(10,6)) plt.plot(X[y==2, 0], X[y==2, 1], "go", label="Iris virginica", alpha=0.3) plt.plot(X[y==1, 0], X[y==1, 1], "rs", label="Iris versicolor", alpha=0.3) plt.plot(X[y==0, 0], X[y==0, 1], "bx", label="Iris setosa", alpha=0.3) from matplotlib.colors import ListedColormap custom_cmap = ListedColormap(["blue", "red", "green"]) custom_cmap1 = ListedColormap(["tomato", "red", "darkred"]) custom_cmap2 = ListedColormap(["teal", "green", "darkgreen"]) plt.contourf(x0, x1, zz, cmap=custom_cmap, alpha=0.2) contour1 = plt.contour(x0, x1, zz1, cmap=custom_cmap1, linewidths=0.5) contour2 = plt.contour(x0, x1, zz2, cmap=custom_cmap2, linewidths=0.5) plt.clabel(contour1, inline=False, fontsize=10, fmt='%1.2f') plt.clabel(contour2, inline=False, fontsize=10, fmt='%1.2f') plt.xlabel("Petal length", fontsize=10) plt.ylabel("Petal width", fontsize=10) plt.legend(loc="center left", fontsize=10) plt.axis([0, 7, 0, 3.5]) plt.show()
-
Reference:
- 기계학습_하길찬 교수님 수업을 듣고 공부한 내용입니다.
- 소프트맥스 이해하기_Cathy
- 소프트맥스 회귀(다중클래스분류)_wiki docs